Skip to content

Platform module

FlexApp Analytics

Up-to-date dashboards and reports your managers build themselves — or simply ask for in plain language.

FlexApp Analytics

In short

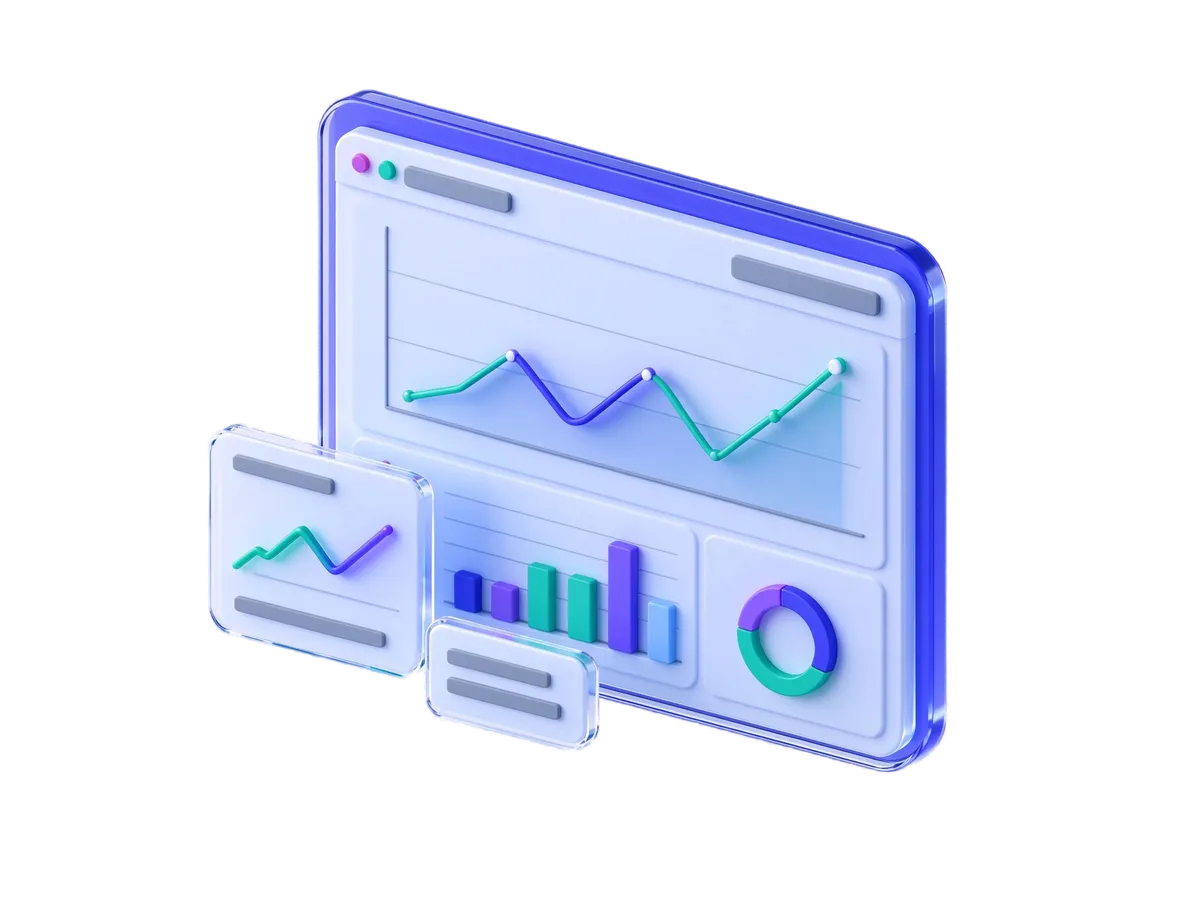
FlexApp Analytics is a self-service dashboard and reporting tool that shows live figures from FlexApp forms, approvals, company lists and connected business systems, so managers see current numbers without waiting for someone to prepare a spreadsheet.

Who it is for

Executives, department heads and analysts who need today's numbers without waiting for IT or a month-end pack.

The problem it solves

Reports are pieced together by hand in spreadsheets, arrive late, and are out of date the moment they are emailed.

What you get

01

Answers without waiting

Business users build their own dashboards and reports by drag and drop.

02

Always current

Reports read live business data — no exporting, copying or pasting.

03

The right report to the right people

Reports go out by email on a schedule, and alerts fire when a figure crosses a limit you set.

04

Just ask

Type a business question and get a table and a suggested chart.

AI

Where AI helps

Get to the figure you need without building a report first.

  • Ask a business question in plain language and get a table and a suggested chart

  • AI helps design dashboards

How teams use it

CFO · trading company

A month-end pack that builds itself

The finance team used to spend days assembling the management pack in spreadsheets. Now the key reports read live figures and are emailed to the management team on a schedule, and the CFO opens the dashboard whenever a question comes up.

Operations director · logistics company

Knowing when something goes off track

Problems used to surface only in the weekly meeting. The operations director now gets an alert when a figure they watch crosses the limit they have set, so they can act before the meeting.

Department head · hospital group

Asking a question instead of requesting a report

A department head who needed a new breakdown used to raise a request and wait. Now they type the question in plain language and get a table and a suggested chart in return.

Key features

Included in the FlexApp platform.

  • Dashboards with 15 kinds of display — headline figures, bar, line and pie charts, funnels, gauges, tables and more
  • Dashboards for one company or across several companies in the group
  • Detailed reports with grouping, totals, pivot tables, highlighting and click-through to the detail
  • Figures come from forms, approvals, shared company lists and your other business systems
  • Reports emailed on a schedule, alerts on limits, and export to Excel, CSV or PDF
  • Share with chosen groups, show a dashboard in another system, and discuss figures with comments and mentions

Frequently asked questions

Do we still need a separate BI tool?

Not for your FlexApp data — dashboards and reports read it directly, along with connected systems. You can still export to other tools if you use them.

Can reports reach managers automatically?

Yes. Any report can be emailed on a schedule to individuals or groups.

Who controls what each manager can see?

Dashboards and reports are shared with chosen security groups, so each person sees only what has been shared with them.

See FlexApp running your process

Tell us about one process you want to fix. We will show it working in FlexApp in a 45-minute demo.